PRISEM Data Query
Introduction
The PRISEM system collects data from a number of participating organizations, correlates it, saves it in a database for archival purposes, and produces alerts based on a number of factors. At the core is an instance of the Collective Intelligence Framework (CIF) that is used to produce watchlists for detectors, as well as to provide context about indicators of compromise (IOCs) that are available from many sources.
Over the years, data query mechanisms were developed that allow searching through archived network flow records, correlating end points of connections with data in CIF, identifying “friend” or “foe”, and other data processing tasks. These programs use an AMQP message bus architecture.
The server running rabbitmq for AMQP message bus funtionality used by the PRISEM system components for data query is “red.devops.local”. It provides AMQP access via TCP port 5672 and is managed on TCP port 55672.
This document describes the high level architecture, the data flows, and the specifics for programs using the PRISEM data query programs to process data.
PRISEM AMQP bus architecture
PRISEM rabbitmq bus architecture
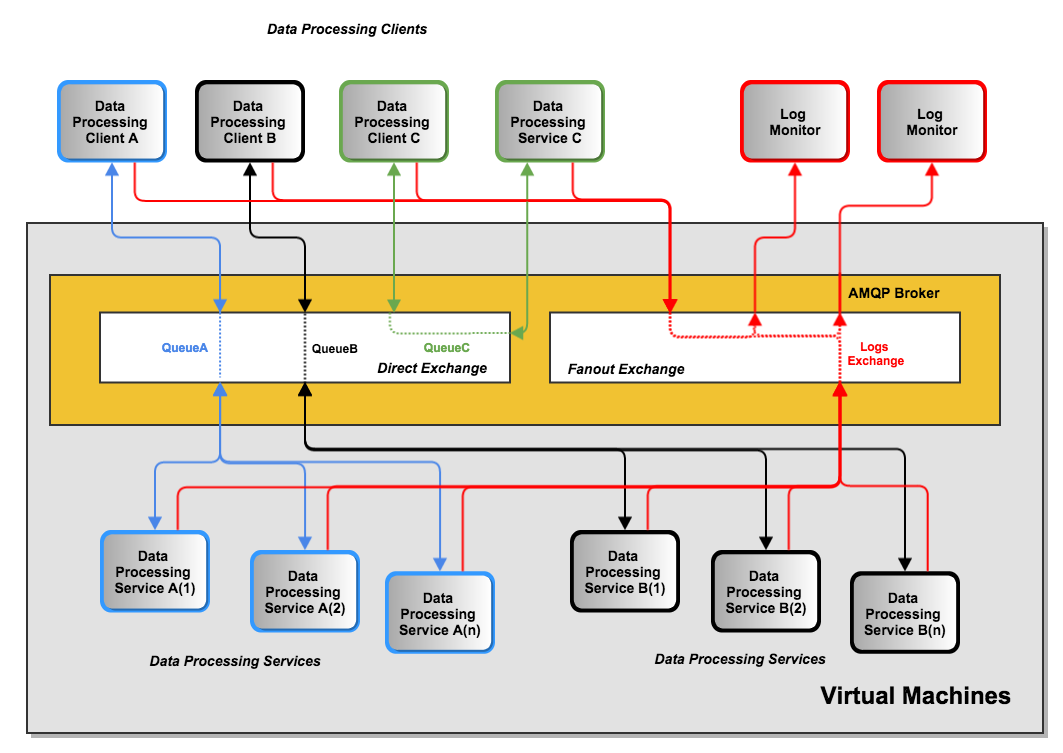
PRISEM rabbitmq bus architecture illustrates how rabbitmq is used for processing data held in various locations within the PRISEM architecture.
The features shown in this figure are as follows:
- The boxes within the gray box labelled “Virtual Machines” are (surpise!) virtual machines. This includes two services A and B, as well as the rabbitmq service itself. (For scalability and redundancy, the rabbitmq service could be on separate hardware, but in a low-demand environment, it is acceptable to run everything depicted in this diagram within a single virtual machine hypervisor.)
- Within the amber box is the AMQP broker (in this case, rabbitmq). Two separate exchange types are shown, a direct exchange and a fanout exchange.)
- Three separate data processing services are shown as boxes colored green, blue, and black. The blue (service A) and black (service B) services have multiple daemon processes available to handle high-volume requests when that is possible, while the green boxes depict a service that has a single service C on systems outside of the central virtual environment (e.g., SiLK data being stored on a remote system).
- The red boxes and lines depict a fanout exchange being used for logging activities. Every one of the green, blue, and black clients and servers all send information via the red fanout connections to the rabbitmq service, which in turn sends a copy to every program that is listening to the specific fanout exchange (in this case, the “logs” exchange). Two external processes (the red boxes in the upper right of PRISEM rabbitmq bus architecture) will receive all of the logged events from all of the processes. This helps with debugging, monitoring the system, gathering processing statistics, and many other beneficial tasks.
PRISEM data flows
PRISEM data flows through “red.devops.local”
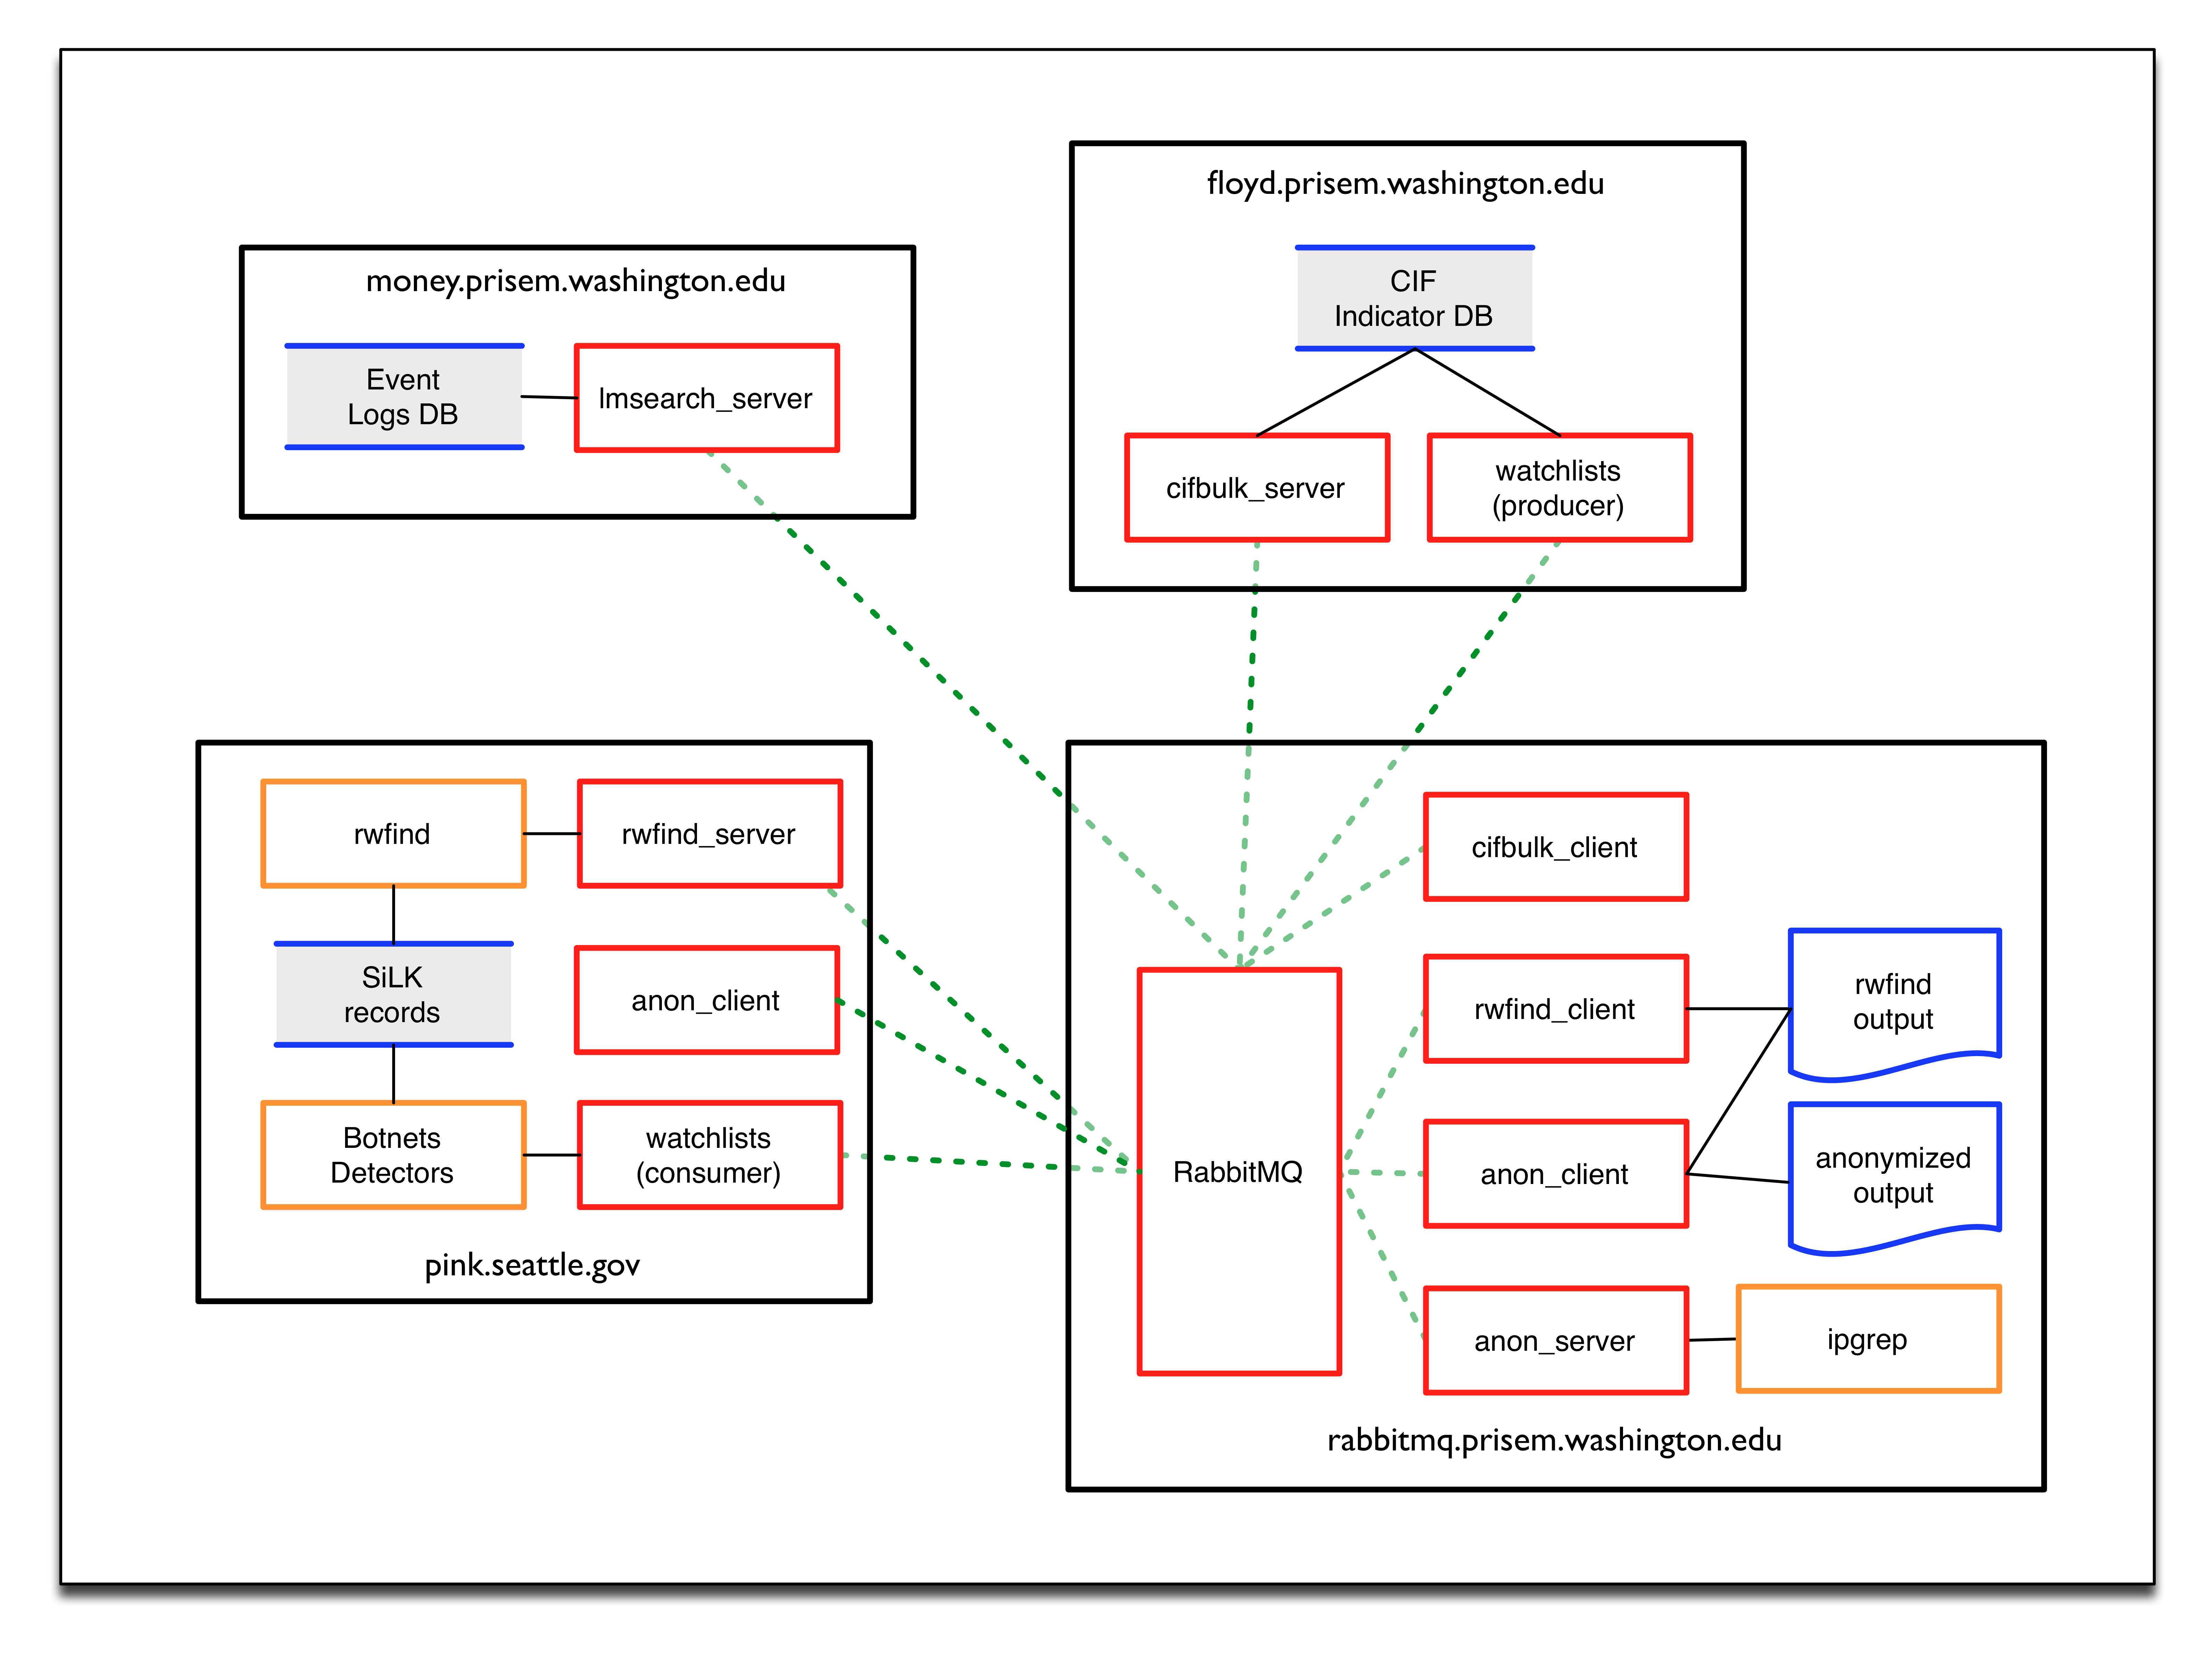
PRISEM data flows through “red.devops.local” illustrates how various components within the PRISEM architecture perform data processing using rabbitmq services on “red.devops.local”. Elements within this diagram are as follows:
Black boxes represents PRISEM system computing resources. These can be either bare-metal computers, or virtual machines. They are logically seen on the network as hosts with unique IP addresses, regardless of whether they are physical or virtual. (In the long run, they could all be virtual machines running in a “cloud” infrastructure. That is irrelevent to understanding how they function in terms of being clients or servers with a larger system of systems.)
Within each of the black box systems, are processes that serve as either “clients” or “servers”. In this sense, a “client” is a program that either (a) has some data and needs something done with that data, or (b) knows how to describe some data that it needs and requests some other “service” that holds the data to provide that data. Examples are asking for the records of every network flow between May 1, 2014 at 10:00 to May 2, 2014 at 23:45 that come from a specific set of IP addresses or network CIDR blocks, or to take the results of that query and anonymize them such that they can be shared with outside entities without exposing the organization who owns the computers associated with those flows.
Red boxes are programs running as clients or daemons (services) that use rabbitmq as a message bus for receiving and processing requests.
Blue lines around a gray block are data sinks. These are either an actual database (e.g., Postgress, MySQL, Vertica, or some other relational or non-relational database), or are files stored in a filesytstem (e.g., SiLK records, which are discrete binary files in a directory hierarchy). The blue “sheets” of paper in the bottom right black box depict files (in this case, output text files) that are obtained by clients calling services. The
rwfindprocess obtains a text report of raw network flow records, then uses theanon_clientto sends the file to theanon_service, which (surpise!) anonymizes the file so it can be share outside of the group in anonymized form.Amber boxes are programs (either command line programs, or daemon processes running in the background) that perform some task. For example, the “ipgrep” box in the lower right hand corner of PRISEM data flows through “red.devops.local” does anonymization, or generates statistics for cross-organizational correlation purposes, while the “Botnets Detectors” and “rwdfind” programs (respectively) produce or consume SiLK network flow records.
Solid black lines are direct access between programs and data stores locally within a computer system.
Dashed green lines between the red program boxes illustrate data flows between them as they use rabbitmq to mediate the requests. The relationship between these programs is explained in more depth later in PRISEM rabbitmq bus architecture. The data that flows over these connections is described in more detail in How does this data processing mechanism work?.
AMQP Data Processing Requests and Responses
We know discuss how rabbitmq is used by PRISEM for data processing
over AMQP. Several AMQP (or AMQP-like) message bus architectures can support
this same mechanism, including RabbitMQ, ZeroMQ, the Honeynet Project’s
hpfeeds, etc. PRISEM uses rabbitmq.
What does “data processing” mean in the context of PRISEM and DIMS?
The term “data processing” in this context is very simple. It means using a structured command request and response data structure that acts like a language, or protocol, for programs that want to ask for something to be done, and for other programs to do those things and return the result to the requesting program.
The AMQP message bus is used as a queueing mechanism for requests. This is done for scalability. If one program can’t handle the number of requests it receives from programs needing the service it provides, you can add more programs to provide that service. RabbitMQ handles managing the queue and handing out jobs to workers. If the worker dies, and doesn’t provide a response to the program that needs a service, rabbitmq will notice the failure to acknowledge the request and give that request to another worker.
Why is this data processing mechanism important?
The mechanism being used for remote procedure calling is designed to tie together a bunch of different programs, written in different programming languages, running on different computers, which are running different operating systems, on different networks.... Get the point? It doesn’t matter what language some program is written in, or where it is running. If some program needs to anonymize data, send it to the anonymization service. If another program needs to look up a bunch of IP addresses in the Collective Intelligence Framework database, send it to the CIF bulk query service. If some program becomes the bottleneck, or the computer it is running on hits 90% CPU utilization and slows things down, create a new virtual machine and off-load processing of that service to the new VM. The data processing mechanism provides scalability, flexibility, connectivity, and a bunch of other ity things that you can’t get easily any other way.
How does this data processing mechanism work?
It works by using a self-imposed standardized “protocol” or “language” for a “client” and “service” to communicate. Again, this is really simple. Just think about abstraction. Rather than every program having to know exactly how to specify a command line, with options, arguments, etc., in the format required by the underlying program you want to invoke, or requiring specific language and operating system specific API calls over TCP/IP, think about a (semi-handcuffing, or “least common denominator”) intermediary “language” that looks the same no matter what service you are asking for and that is easy to parse with any programming language you want to use in order to provide that service.
If you want a non-programming model, think about the air traffic control system. Does every air traffic controller have to know every language spoken on the planet Earth, where any arbitrary pilot who wants to fly a plane could have grown up? Do they have to understand every word in those languages, so that regional slang terms and words with multiple (possibly even conflicting) meanings, do not result in trying to say “pull up!!!” to avoid crashing into a plane below and having the pilot hear “slow down!!” which results in, well, you get the idea. Of course not! That would never work and planes would be crashing on a daily basis. What they decided to do was to standardize on everyone speaking English, and even then, only a limited subset of English with specific words that each have only one clear, unambiguous meaning. That allows any plane, originating from any country, to land in any other country (provided they have enough jet fuel to make it there).
So back to programming. This generalization allows for a much simpler way of tying any two programs together that actually can scale and be extended quickly and easily to new services. It has some shortfalls, but it also has some powerful benefits. Go with the benefits and we’ll figure out how to deal with the shortfalls later. It is more important to get a bunch of things working together than it is to develop the perfect new language that binds everything in the world together. Read the Cult of Done Manifesto as a starting point for moving forward rather than over-engineering things into prolonged stasis.
The standardized “protocol” is based on a high-level JSON structure that defines a “command” and a “response,” which also includes an application-specific set of input and output data. The input and output data is not standardized, since we are using the PRISEM data processing mechanism to tie a bunch of underlying command line programs together, and they are all written in a particular way, in particular languages, with particular command line options and syntax. In other words, there is no “one size fits all” and it is a waste of time to try to add data parsing for all possible programs that want to ask for some service and have those all be supported in every service that you could possibly want to use. That simply does not scale, and if you didn’t write every program yourself, or don’t know how to modify every program in every language, you will never link them all together directly. Get over it. It isn’t going to happen. —+ What does this protocol look like, and how does it work?
Here is a command (request) structure for the CIF bulk service:
{ "appdata": { "etime": "1413619631", "noheader": "false", "searchfile":
"NzcuMjIyLjQwLjQ0Cjk1LjIxNS4xLjIyMgoxNjIuMjEwLjEwMS4xNDIK", "stime":
"1413014831" }, "hostname": "dddesktop", "name": "cifbulk", "pid": 4384,
"pika_version": "0.9.8", "platform": "#25~precise1-Ubuntu SMP Thu Jan 30
17:39:31 UTC 2014", "protocolver": "0.5", "release": "0.5.5", "time":
1413590832 }
Here is what a response from the CIF bulk service looks like:
{ "appdata": { "retcode": 0, "stderr": "", "stdout": "eyJpZmYiOiAiZm9lIiwg[
a ton of characters deleted... ]iAxNDEzNTkwODM2fQ="
    }, "hostname": "dddesktop", "name": "cifbulk", "pid": 4269,
    "pika_version": "0.9.8", "platform": "#25~precise1-Ubuntu SMP Thu Jan
    30 17:39:31 UTC 2014", "protocolver": "0.5", "release": "0.5.5",
    "time": 1413590836
}
You will notice several fields in the top level of the JSON object that are common. Those are:
hostname- The short hostname (maybe should be fully qualified?) where the program is running. This is primarily to help identify which computer you have to log in to when you have to debug something that is broken.name- The name of the service being used. (This is partly to ensure that commands aren’t sent to the wrong queue, and partly for self-documentation.) Don’t worry, just fill in this field with the right value.pid- The process ID of program that is requesting/responding (primarily for finding a process to kill and/or debug if there is a problem)pika_version(or other AMQP library that is being used) - This is just to identify the AMQP library being used, for debugging purposes primarily. Don’t ask why, just note which AMQP library you are using so you can figure out why it broke.platform- The operating system under which the client or service is running on (again, for debugging purposes, and don’t ask why, just include this information in the request/response)release- This one matters, or is supposed to matter. It is the version number of the command protocolprotocolver- This is the protocol version number (both this, and thereleasenumber, are related to semantic versioning for determining compatibility - if they don’t match, don’t expect things to work properly)time(in Unix seconds from the epoch notation) - When was the request/response created (just for historic purposes, mostly related to debugging... do I need to say, “Don’t worry about it, just put it in?”)
Beyond those common fields, there is an appdata field that contains the input
and output data. In particular, appdata for a request contains the input
data, any options that are to be invoked, etc. There are no direct command line
arguments or options being passed (since these can create a security
vulnerability in the form of command injection). Instead, any required options
or arguments are specified in the JSON on a per-service basis. If there are
needed fields that are not there, we add them. (That is what “Agile
development” and “continuous integration” are for.)
In the example above of CIF bulk queries, the only options are:
etime- The “end time” of a time frame for the request (i.e., don’t include anything after this time)stime- The “start time” of a time frame for the request (i.e., don’t include anything before this time)noheader- Should header information be included?searchfile- A BASE64 encoded string containing the input data (in this case, a list of search items for CIF)
In every case of the PRISEM data processing services, there are three elements to the appdata structure being returned. Those are:
stdout- The text (if any) that came out on the standard output file handlestderr- the test (if any) that came out on the standard error file handleretcode- The return code of the subordinate program that the service is front-ending (i.e., the program that ran in a sub-process, or the error result of the service if it isn’t calling a subprocess to provide the service it is providing). It is just common decency to tell the calling program what happened, if something went wrong. (“No silent failures!”)
One thing you will probably notice immediately is that the fields searchfile,
stdout, and stderr all look like gibberish. They are BASE64 encoded
versions of the contents of the files in the filesystem that are sent to, and
received from, the services being invoked. This is to avoid any problems with
having to escape characters, etc. Again, don’t ask why. Just BASE64
encode/decode any of these fields when using these data processing services.
That is how they work.
If any of this does not make sense, talk to Dave. If you think you know a better way of doing things, make it work first, then suggest a way to improve it later. It is more important to get something integrated into DIMS and working than it is to make it perfect (or worse, sitting around half-finished).
Logging via AMQP
In addition to the PRISEM data processing services, originally intended as a
means of debugging, is a logging fanout capability. The Python program used for
monitoring or sending messages on these fanouts is logmon and it works as
both a sender and receiver, depending on which command line options you use.The
default is to monitor messages on the selected fanout, and the default is the
logs fanout. (In AMQP terms, these messages are sent to an exchange, of
type fanout, so the term fanout is often used in talking about this logging
mechanism.)
The format for log messages used in DIMS employs the following fields:
- Timestamp in ISO 8601 format
- The host where the message initiated (host name and/or IP address)
- A GUID (as opposed to just a process ID)
- The piece of code producing the log statement (e.g., a classname, or where do you look in the codebase should an error arise)
- The logging level (
INFO,DEBUG, ...)- The log message (i.e. what was being said)
To help map the GUID to a process, in the case of multiprocessing with multiple instances of the same program running, it is important to map process ID (PID) to GUID, so initiating a process should generate a log message that includes all of these attributes for linking.
2014-11-05T16:52:16-0800 rejewski 431270e5-b42a-4625-801d-1777dd9eff81 edu.uw.apl.tupelo.http.server.AttributesServlet DEBUG 'Get.PathInfo: /get/32m/20141029.0023/md5'
2014-11-05T16:52:16-0800 rejewski 431270e5-b42a-4625-801d-1777dd9eff81 edu.uw.apl.tupelo.http.server.AttributesServlet DEBUG 'getAttribute.details: '32m/20141029.0023/md5''
2014-11-05T16:52:16-0800 rejewski 431270e5-b42a-4625-801d-1777dd9eff81 edu.uw.apl.tupelo.http.server.AttributesServlet DEBUG 'Get.ServletPath: /disks/attr'
2014-11-05T16:52:16-0800 rejewski 431270e5-b42a-4625-801d-1777dd9eff81 edu.uw.apl.tupelo.http.server.AttributesServlet DEBUG 'Get.PathInfo: /get/64m/20141028.0029/md5'
2014-11-05T16:52:16-0800 rejewski 431270e5-b42a-4625-801d-1777dd9eff81 edu.uw.apl.tupelo.http.server.AttributesServlet DEBUG 'getAttribute.details: '64m/20141028.0029/md5''
2014-11-05T16:52:16-0800 rejewski 431270e5-b42a-4625-801d-1777dd9eff81 edu.uw.apl.tupelo.http.server.AttributesServlet DEBUG 'Get.ServletPath: /disks/attr'
2014-11-05T16:52:16-0800 rejewski 431270e5-b42a-4625-801d-1777dd9eff81 edu.uw.apl.tupelo.http.server.AttributesServlet DEBUG 'Get.PathInfo: /get/32m/20141029.0019/md5'
2014-11-05T16:52:16-0800 rejewski 431270e5-b42a-4625-801d-1777dd9eff81 edu.uw.apl.tupelo.http.server.AttributesServlet DEBUG 'getAttribute.details: '32m/20141029.0019/md5''
2014-11-05T17:01:53.628154-08:00 27b-6.local 76f1f5bb-19b2-4696-adbc-b5598cb35d1a logmon INFO #!/usr/bin/env python
2014-11-05T17:01:53.628483-08:00 27b-6.local 76f1f5bb-19b2-4696-adbc-b5598cb35d1a logmon INFO
2014-11-05T17:01:53.628688-08:00 27b-6.local 76f1f5bb-19b2-4696-adbc-b5598cb35d1a logmon INFO import time
2014-11-05T17:01:53.628883-08:00 27b-6.local 76f1f5bb-19b2-4696-adbc-b5598cb35d1a logmon INFO import sys
2014-11-05T17:01:53.639685-08:00 27b-6.local 76f1f5bb-19b2-4696-adbc-b5598cb35d1a logmon INFO import os
2014-11-05T17:01:53.639962-08:00 27b-6.local 76f1f5bb-19b2-4696-adbc-b5598cb35d1a logmon INFO import fileinput
2014-11-05T17:01:53.640163-08:00 27b-6.local 76f1f5bb-19b2-4696-adbc-b5598cb35d1a logmon INFO from optparse import OptionParser
2014-11-05T17:01:53.650940-08:00 27b-6.local 76f1f5bb-19b2-4696-adbc-b5598cb35d1a logmon INFO
The log levels parallel those of Unix syslog(5). The strings are all upper case (e.g., INFO). The levels and their respective values are as seen in this list. If not specified, the level will be INFO:
Emergency     (level 0)
Alert         (level 1)
Critical      (level 2)
Error         (level 3)
Warning       (level 4)
Notice        (level 5)
Info          (level 6)
Debug         (level 7)
Reference Python data procssing clients
The PRISEM system has a set of Python reference data processing clients that were written to provide data processing services across multiple components of the Log Matrix system, extending out to command line clients outside of the system via a Virtual Private Network (VPN) connection. These clients serve as examples of how to make AMQP calls as a client to request a service, and how to take the requests off the AMQP bus, process them, and return the results to the client that made the request. Other programs that need to access services have the option of creating a subprocess that invokes one of the Python clients (if you only know how to make subprocess calls and not AMQP calls), or the programmer can take advantage of the very well-documented RabbitMQ client examples to do your own data processing calls in other languages besides Python. The task, then, is understanding how to specify the inputs, select options, and process the resulting output, by processing JSON structures being passed over the AMQP bus.